Tip: This page has strange formatting issues after printing to pdf, as well as parts of the content not displaying properly. If you’re reading through the pdf, consider going to the original site to read it for a better experience!
Project Overview#
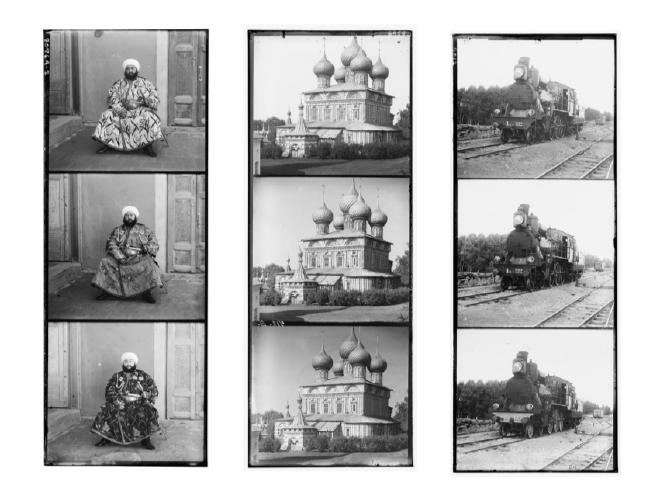
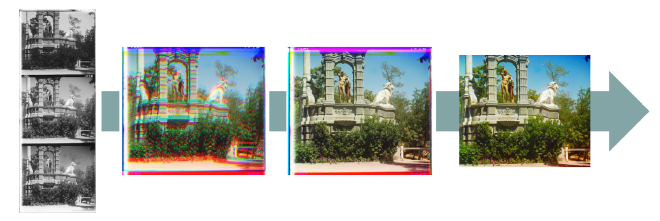
Sergei Mikhailovich Prokudin-Gorskii utilized red, green, and blue filters to capture exposures of various scenes onto a glass plate, making it possible to synthesize color photographs. To reconstruct these color images, we first need to align the three color channel images before combining them into a single color photograph.
This project identifies an efficient image alignment method that not only improves efficiency but also achieves good results. Additionally, further exploration into post-processing techniques was conducted to enhance image quality and aesthetic appeal.
Approach#
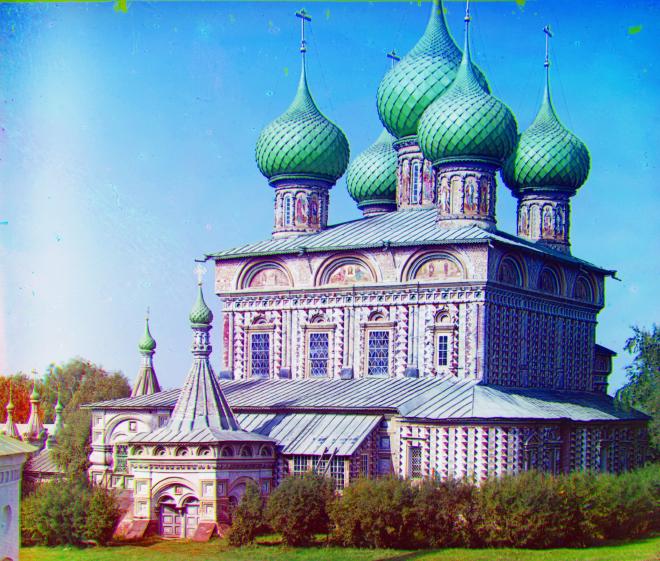
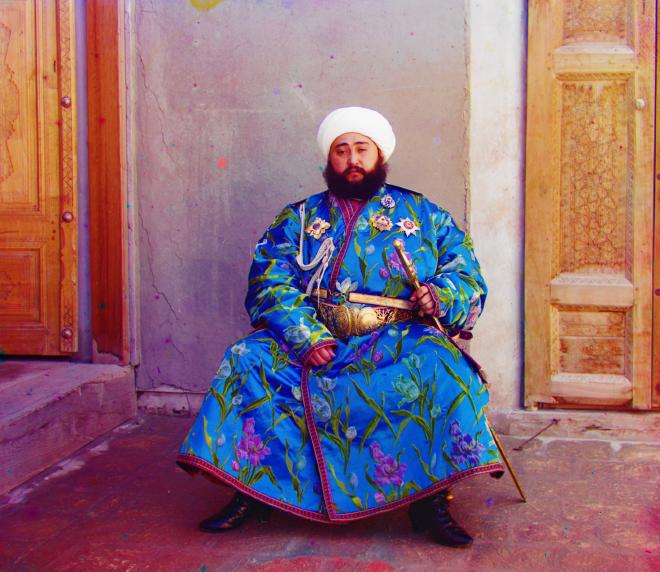
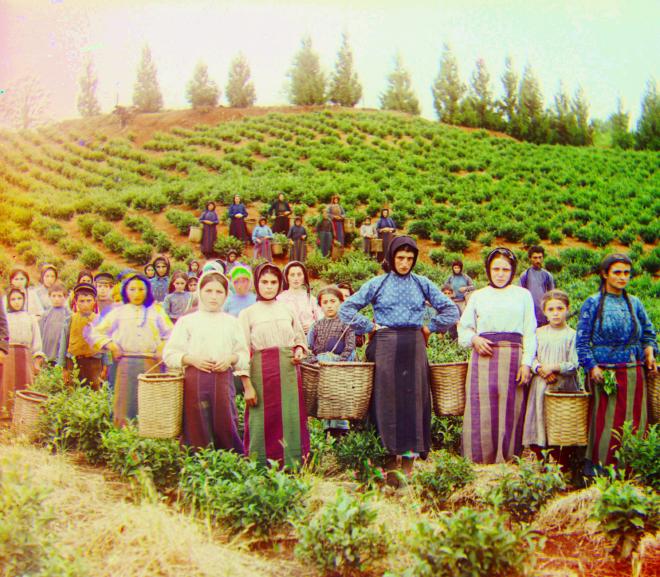
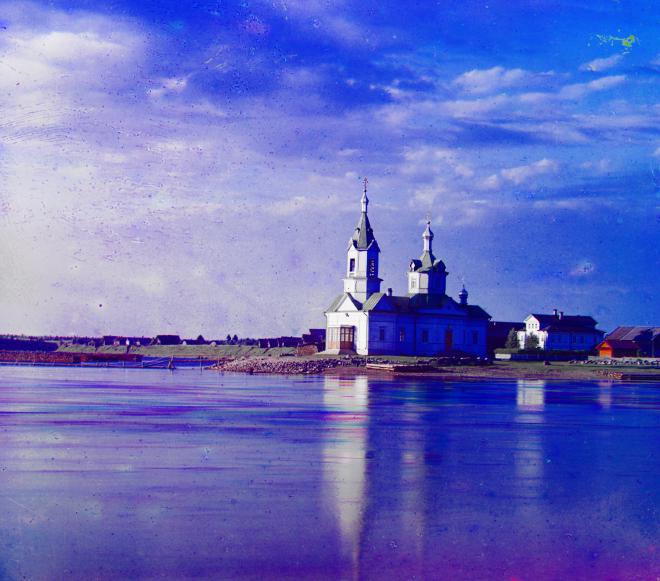
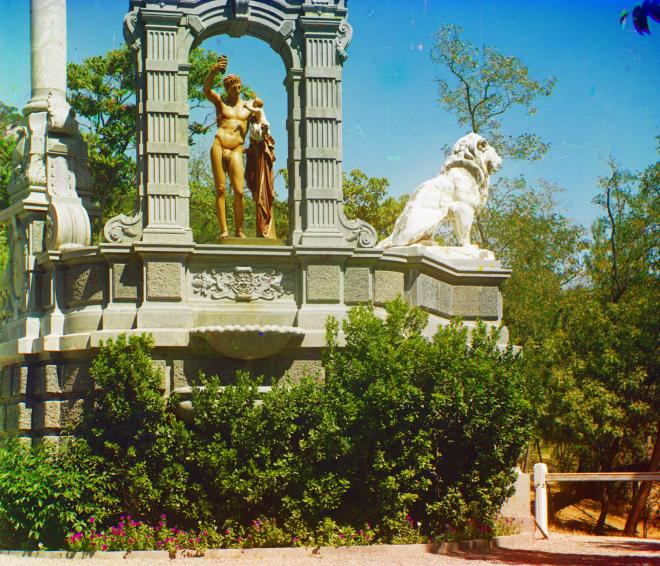
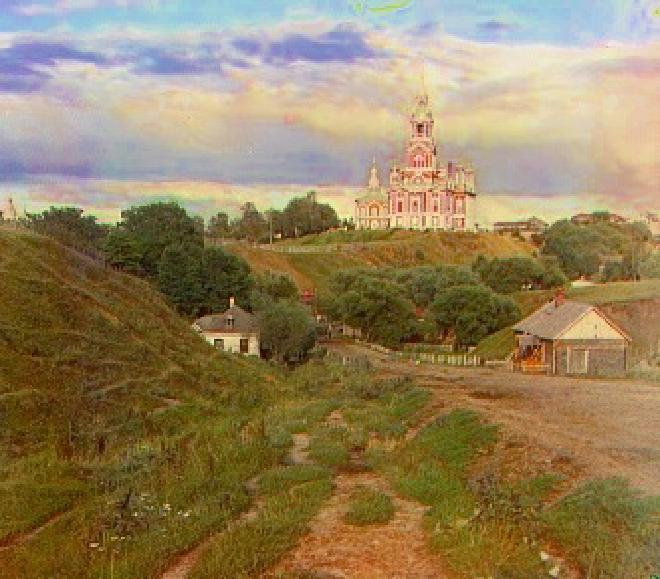
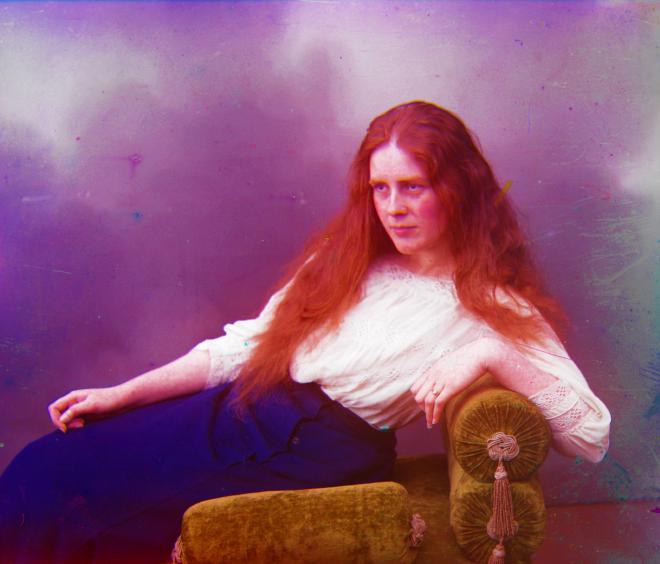
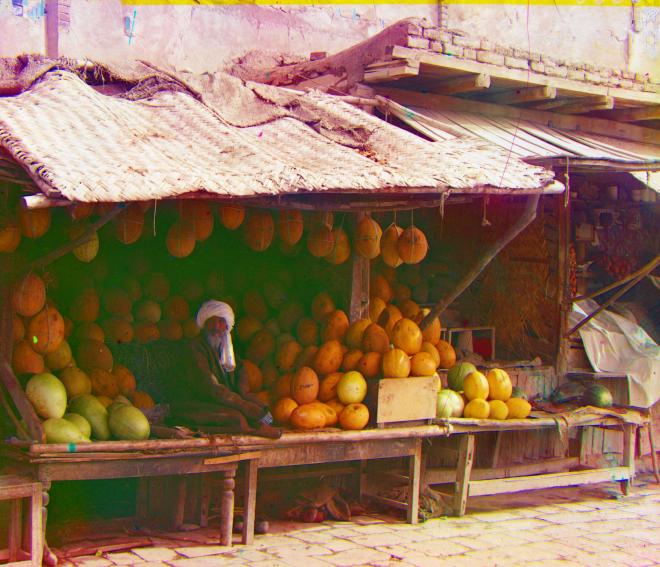
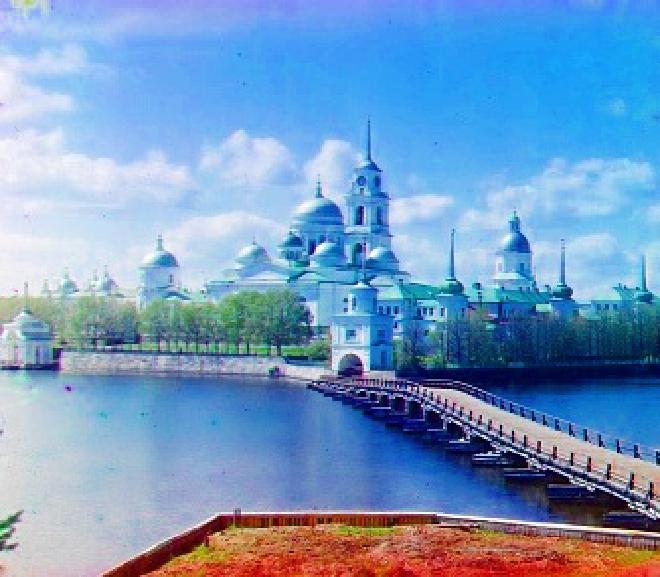
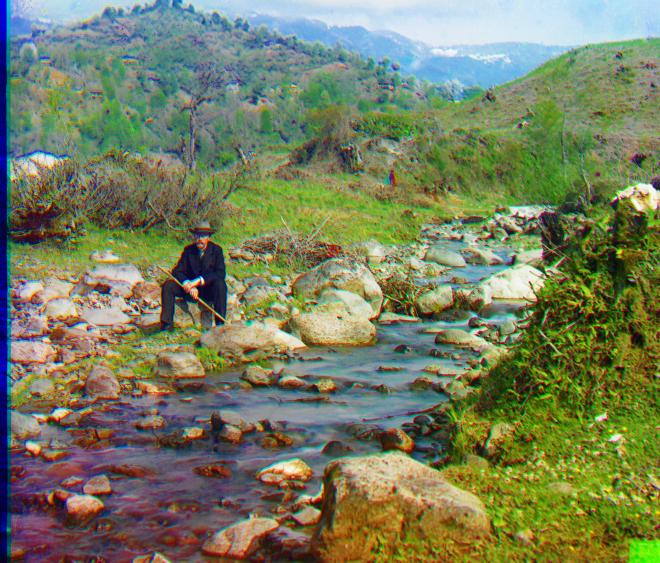
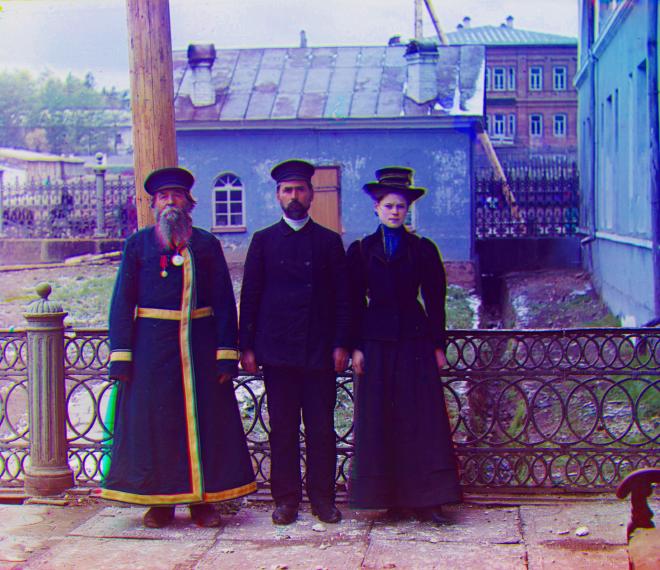
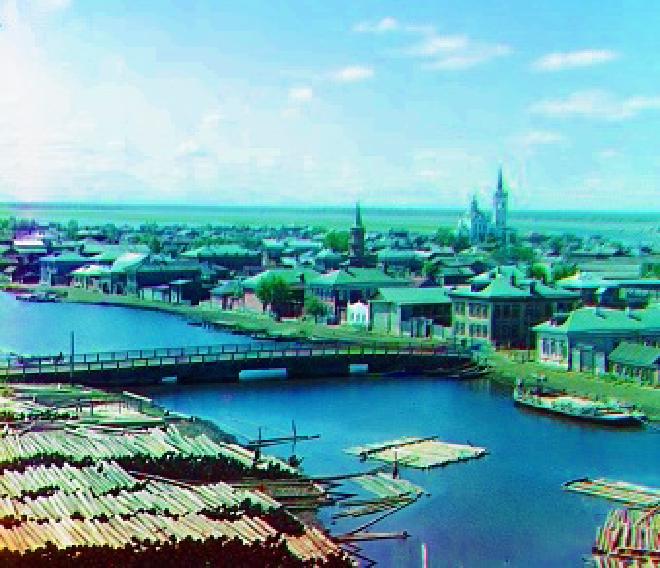
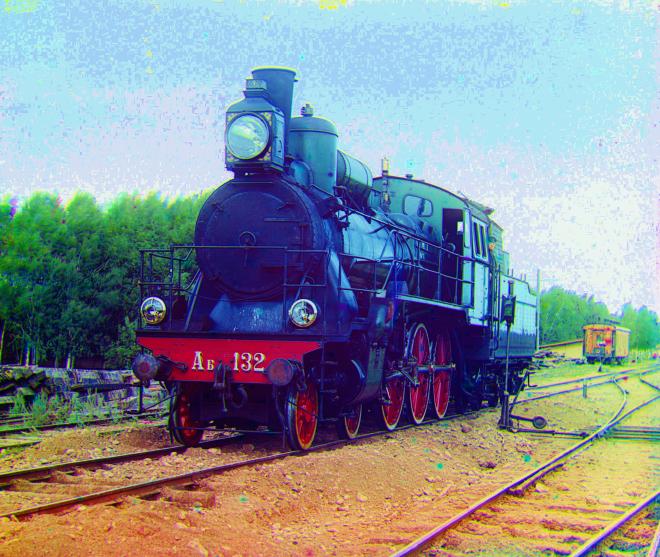
This section is divided into three subsections. First, I attempted a single-scale alignment, which could generally align the images but was very slow in terms of efficiency. Next, I implemented an image pyramid, which significantly improved both the efficiency and the alignment quality. Lastly, in the Bells and Whistles section, I refined the alignment method and experimented with using different image features for alignment, as well as automatic cropping and contrast adjustment, which further enhanced the overall image quality. Here are some of the final results:


Single-scale Aligment#
The basic idea is as follows: we attempt to shift the red and green channel images within a certain range, while keeping the blue channel image fixed as a reference. After each shift, we calculate a metric between the shifted images and the reference. The shift that results in the best metric value is retained. The first important approach is to keep only the inside of the image when calculating the metrics, removing the outer border, which will make the calculation of the results after the move much more stable.
Initially, I tried using Euclidean distance and Normalized Cross-Correlation as metrics. But they’re not good enough.
Therefore, I explored a range of new metrics and ultimately chose Mutual Information, a measure of the dependency between two random variables. The results indicated that Normalized Mutual Information(NMI) more effectively evaluates the alignment quality of different color channels, leading to improved performance in single-scale image alignment. Let \(X,Y \in \mathbb{R}^{m\times n}\) denote the two images that need to align, the NMI between two images is:
$$ NMI(X,Y) = \frac{2 \times I(X,Y)}{H(X) + H(Y)} $$
$$ I(X,Y) = H(X) + H(Y) - H(X,Y) $$
where \(I(X,Y)\) is the Mutual Information of X and Y, and \(H(X), H(Y)\) are their marginal entropies, \(H(X,Y)\) is joint entropy. When process images, we calculate entropies like: $$ H(X) = - \sum_{i} p(i) \log p(i), \quad H(X,Y) = -\sum_{i,j}p(i,j)\log p(i,j) $$ Here ((i, j)) denote the intensity of a pixel in picture X and picture Y respectively, \(p(i)\) denotes the probability that a pixel with intensity \(i\) is in X, and \(p(i,j)\) denotes the probability that the same pixel with intensity \(i\) in X is in Y with intensity \(j\). These probabilities can be easily obtained from histograms.
The results of the alignment using the different metrics are shown below, with NMI being a more effective metric.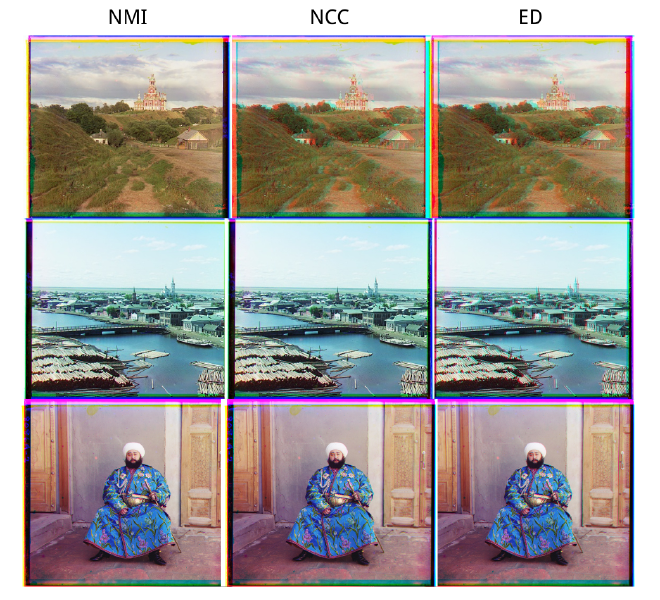
Multiscale Aligment#
I first implemented an image pyramid. In this pyramid, the original image is at level 0, and for each level \(i\), the width and height of the image are reduced to \(\lfloor l/2^i \rfloor\) and \(\lfloor d/2^i \rfloor\), respectively. When aligning the images, we start from the top level of the pyramid, which contains the smallest images. As we proceed to each new level, first obtain the scaled-down images based on the pyramid’s structure. For the images at level \(i\), after determining the necessary shifts for alignment, we multiply the shifts by the corresponding scaling factor (\(2^i\) ) to apply them to the original full-size images. After shifting the original images, we move down the pyramid to align progressively larger images.
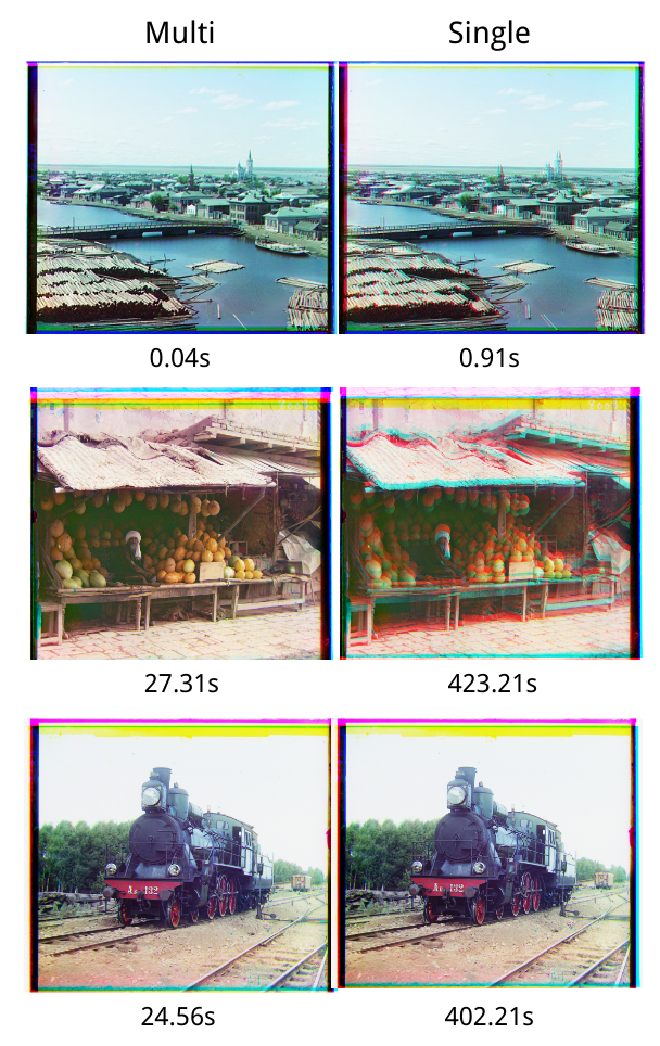
This approach significantly improved computational efficiency, as shown by the time required for the computations in the examples below. Additionally, it enhanced the accuracy of the image alignment.
Bells and Whistles#
Alignment Method Improvement#
When the image pyramid reaches the lower levels, where the images are larger, two issues arise: First, certain areas of the image, such as the sky, occupy significant space but exhibit little variation, causing the metric to change minimally even after image shifts, making it difficult to accurately determine the optimal alignment. Second, a huge amount of pixels makes the computation time quite long.
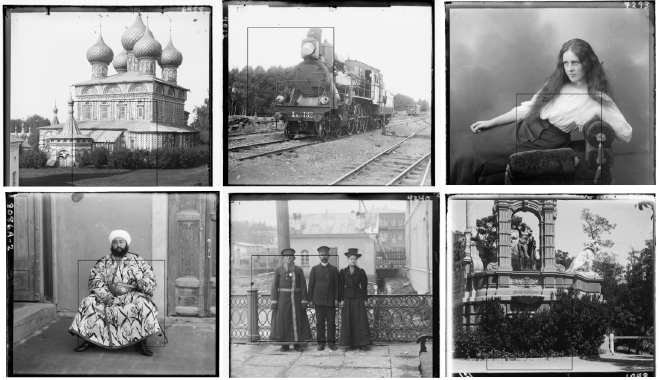
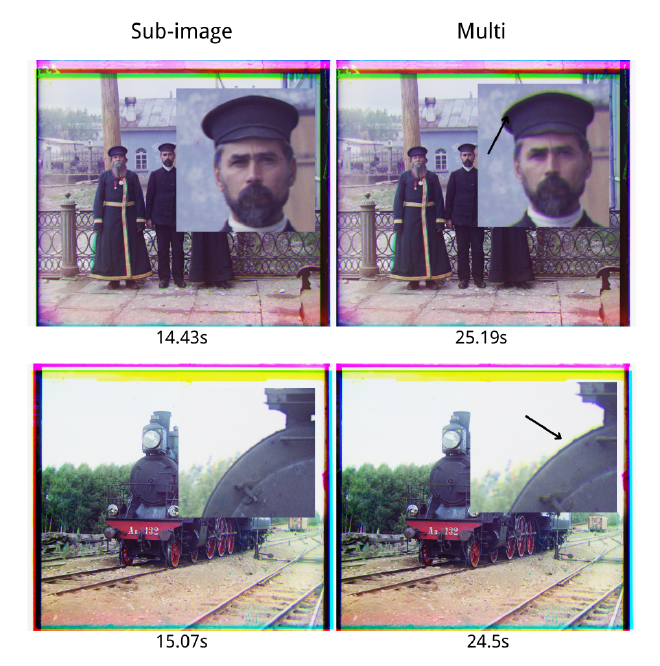
To address these, I use a square window scanned the entire image and identified the region with the highest variance, which typically corresponds to areas with edges, such as the boundary between light and dark regions. I then shifted this sub-image and calculated the metric based on this smaller area. The results show that this not only makes the computation more efficient, but also performs better in some key areas.
In the meantime, I tried using Sobel algorithm to detect the edges of the image and then use the edges for image alignment. But unfortunately this didn’t improve much, slowing down while making the alignment worse for small images or images with complex edges.
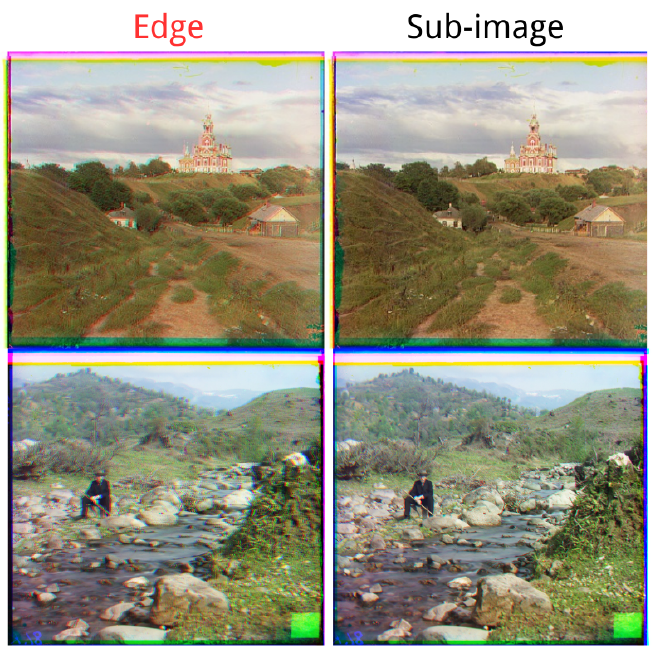
So in the end, mutiscale aligment with NMI plus sub-image, become the final chosen approach.
Automatic Cropping#
The borders of the images often contain black or white areas that should be discarded. I applied a somewhat aggressive binarization to each color channel of the image, turning near-black and near-white areas into black, while preserving other areas as white. Then identified the first rows and columns where white pixels appeared and used them as the new boundaries for cropping.
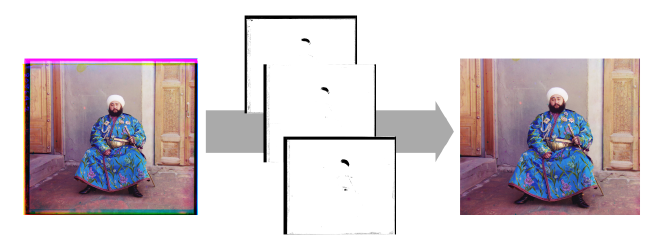
Automatic Contrast#
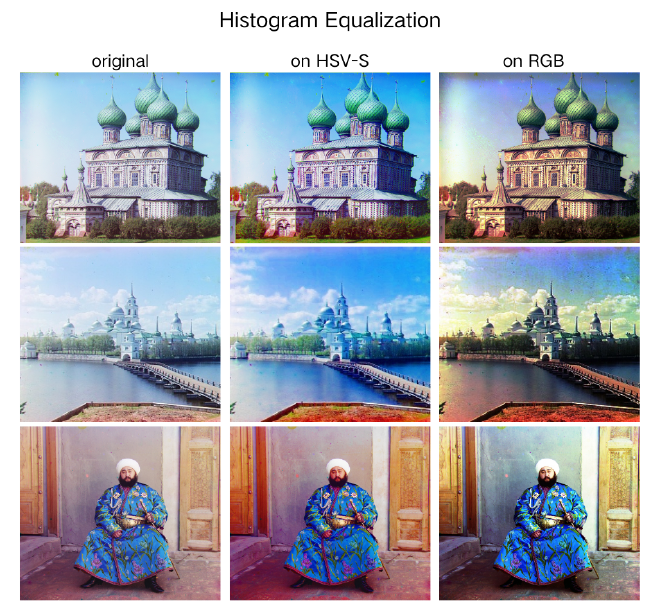
Finally I implemented automatic contrast adjustment. This uses a method called Histogram Equalization. First we need to get a histogram of a single-dimensional feature image (say a grayscale image or an image with a single channel), and then calculate the CDF as a cumulative function of the intensities of each pixel, which will be such that the highest-intensity (usually 255) will have a CDF of 1, and then we multiply all the CDFs by 255 to get a mapping table. At this point we can look up the intensity of each pixel in the original image to find the corresponding adjusted intensity.
But what I need is to adjust the contrast of a three-channel color image. First I tried histogram equalization for all three color channels in turn, but the results were poor. After that I converted the image directly to HSV space and equalized the S-channel (Saturation) alone with good results.
Full Results#
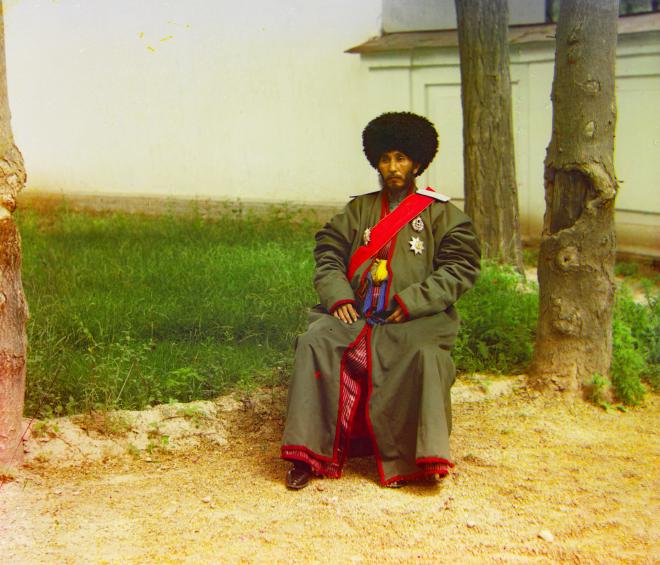
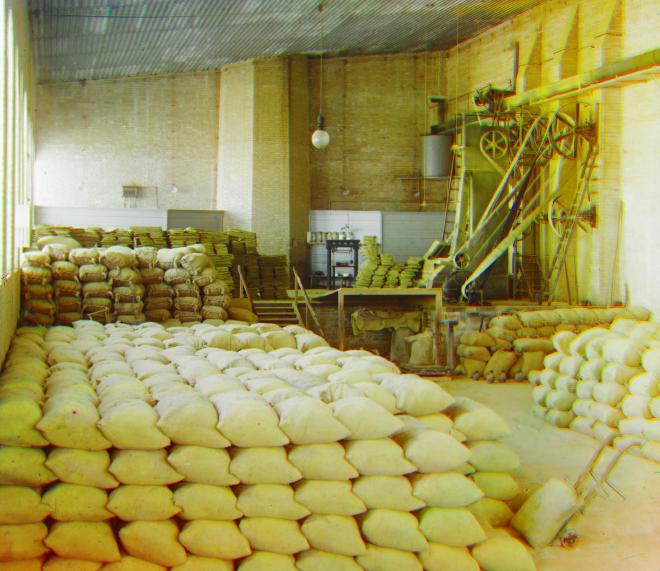
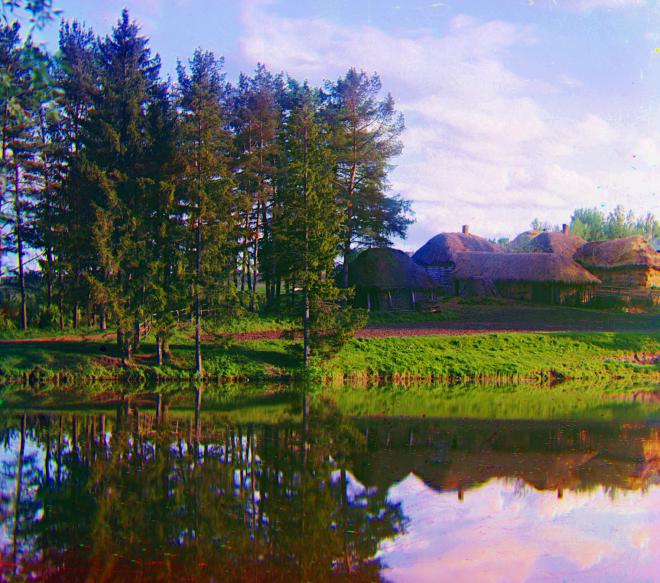
In this section I’ll show the results of the alignment of all the images, and the corresponding offsets. This includes the example images provided and additional images.
Additional Images#
Example Images#
